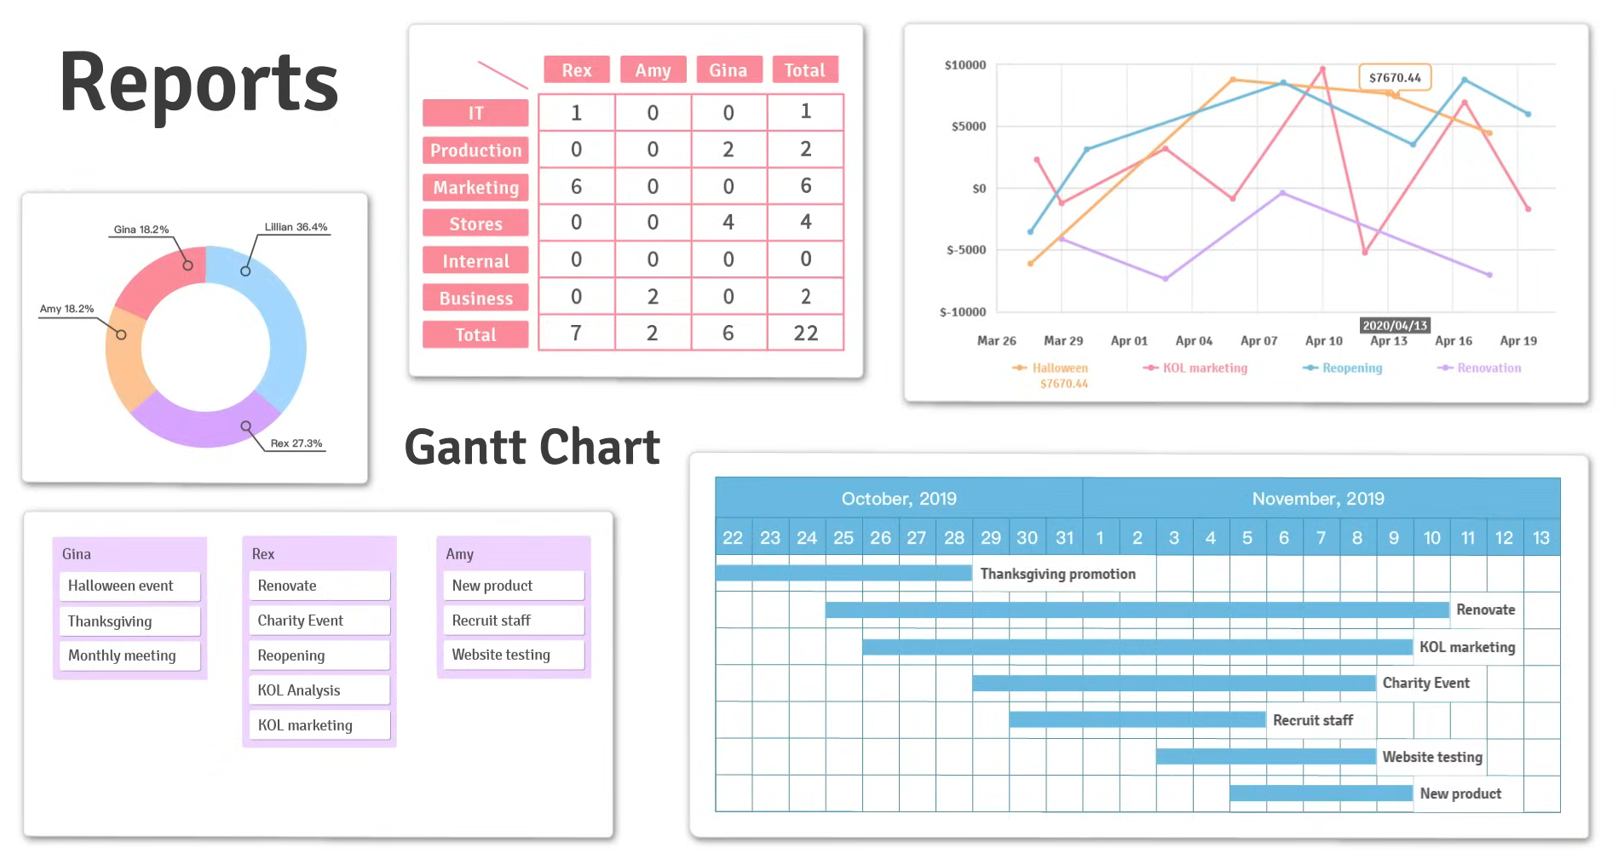
One click is all it takes to present the gist of your data in many shapes and forms.
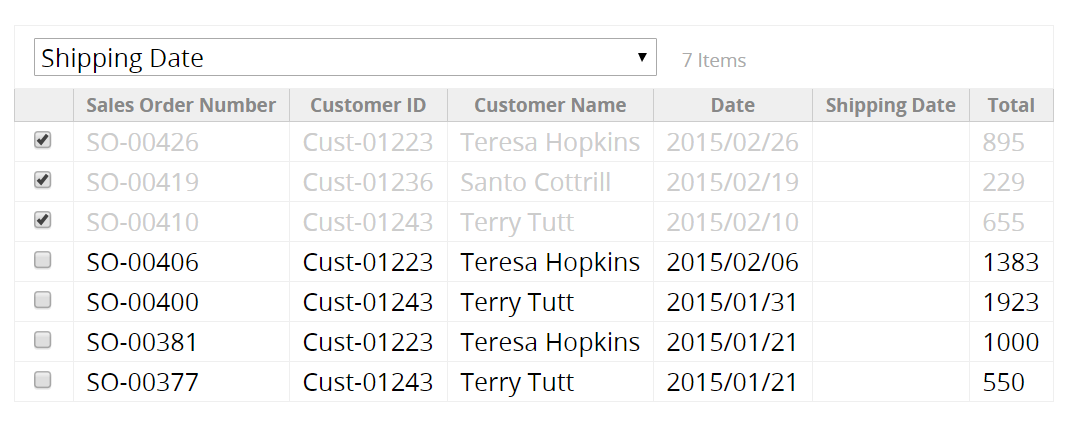
Swiftly consolidate all your order information in dashboard. Read more
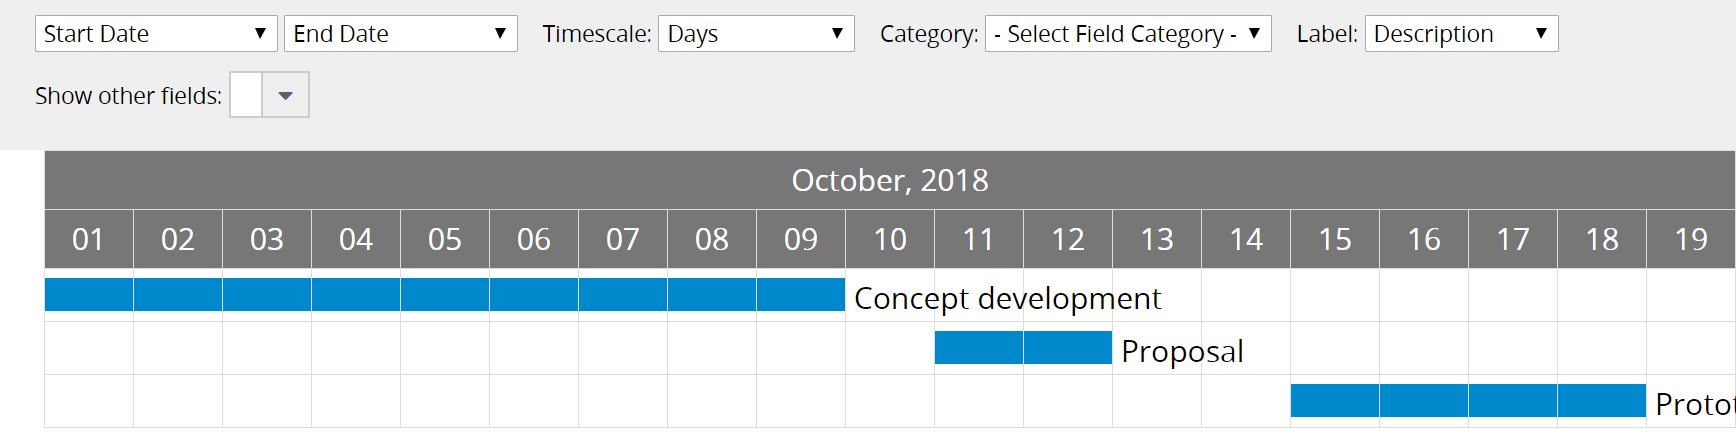
Make your project timetable as clear as a crystal. Read more
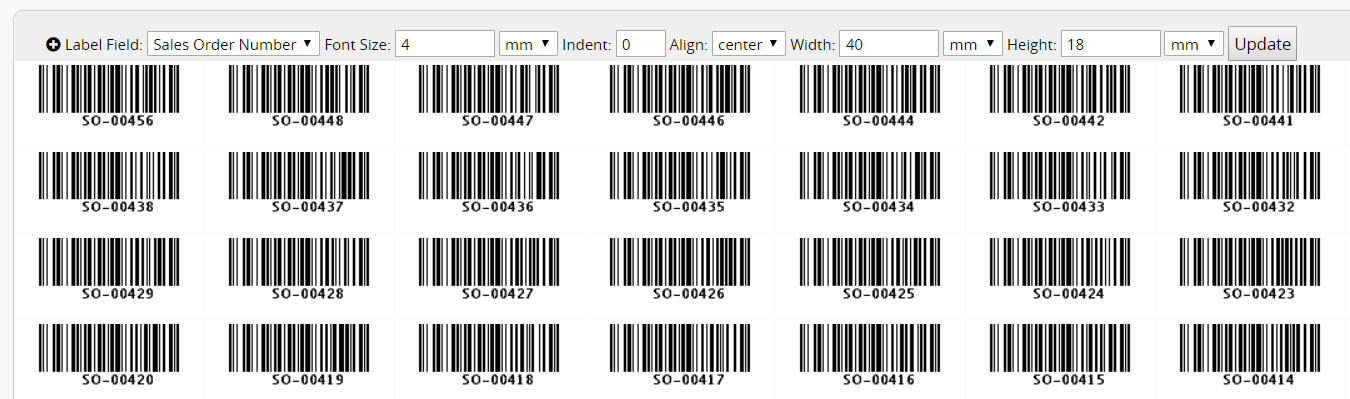
Generate barcodes that goes hand in hand with barcode machines. Read more
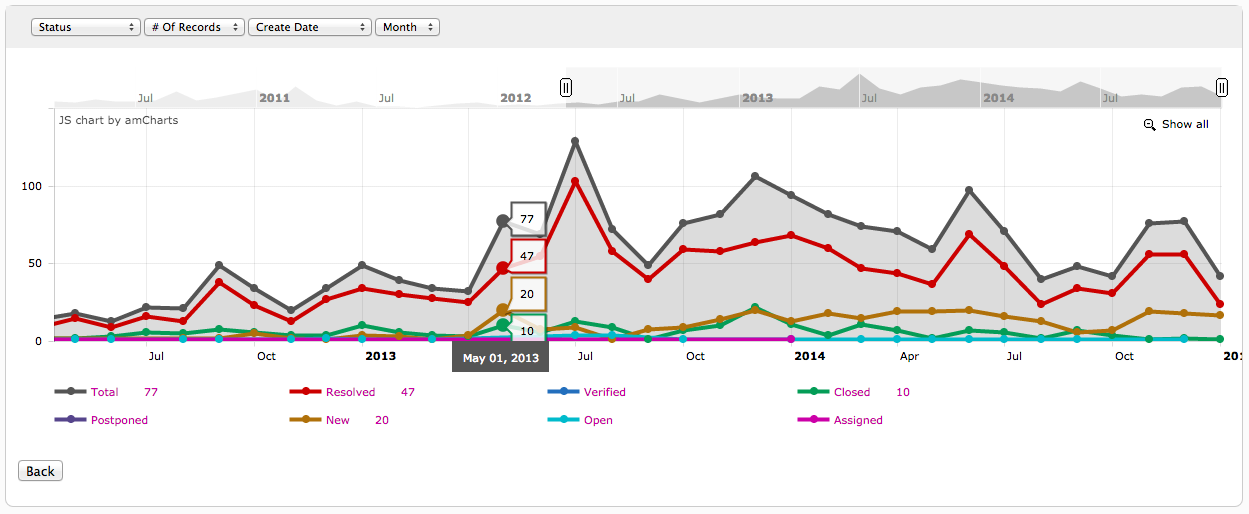
Visualize your company's operational status. Read more
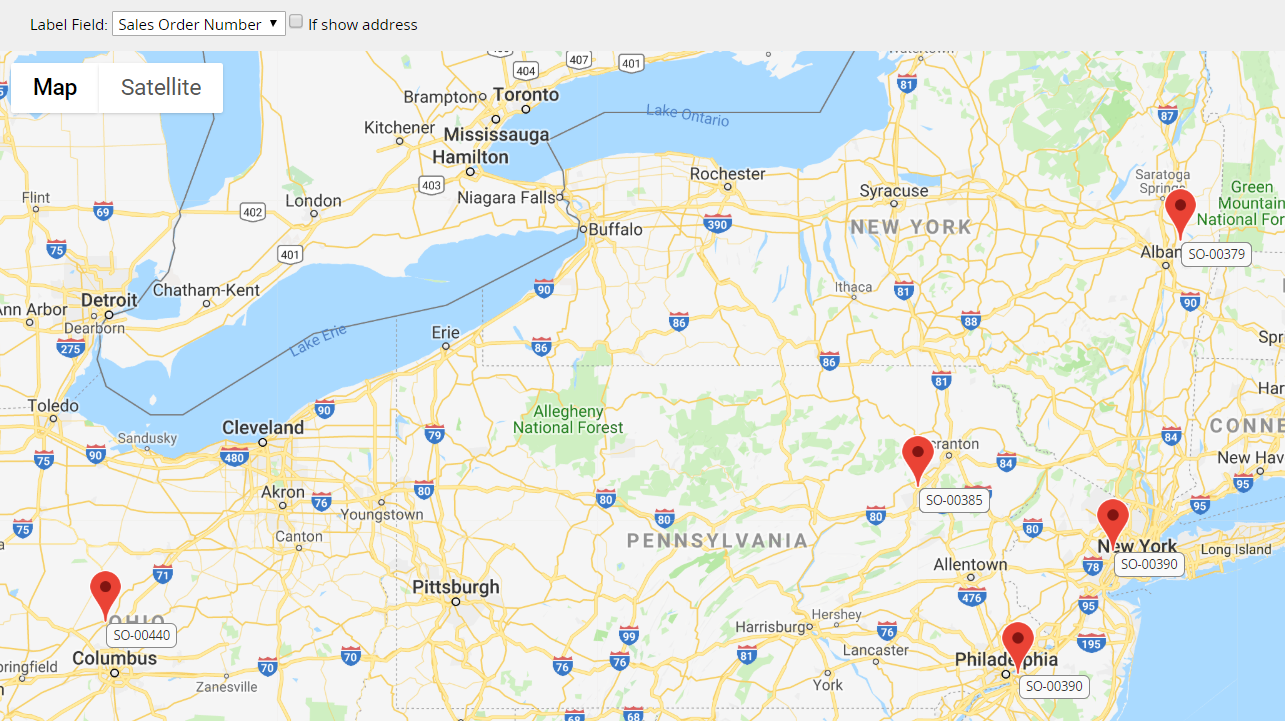
Automatically pinpoint the target location on the map. Read more
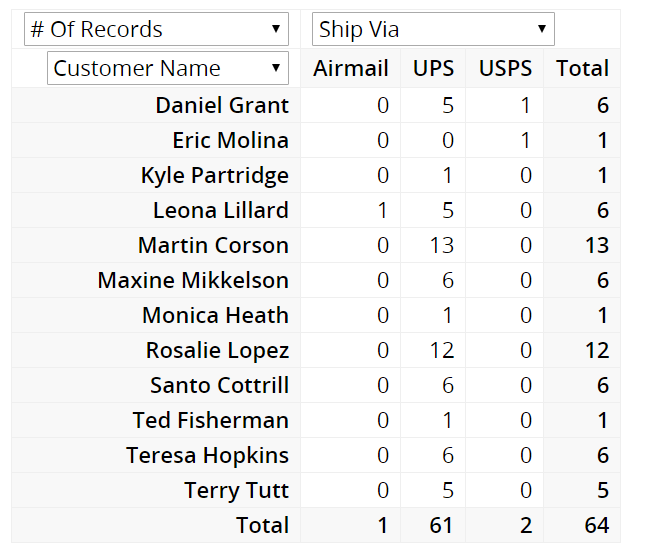
Need to do a cross-analysis? Consider it done with Ragic! Read more
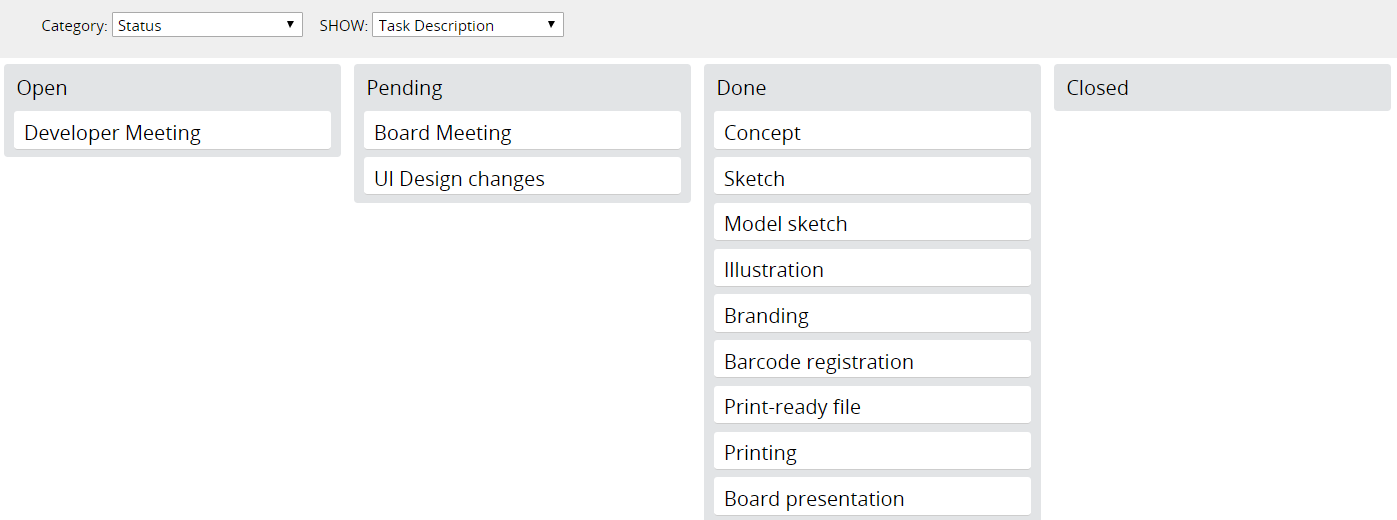
Display your project status in an elevated style. Read more
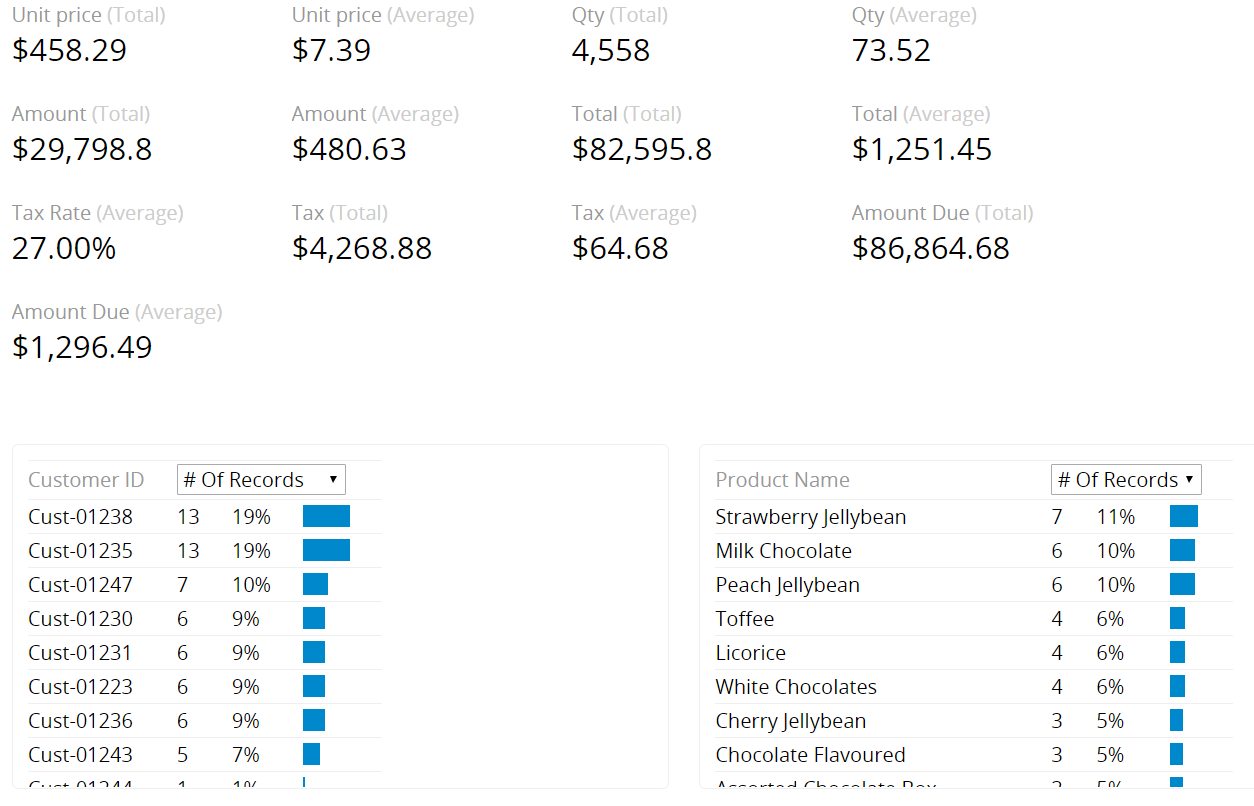
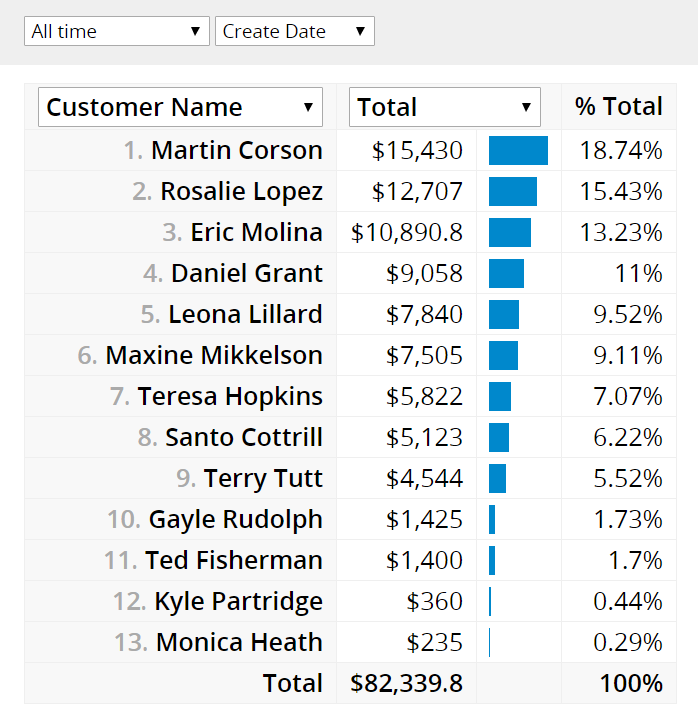
Rank the most contributive sales reps of the month or list the company's best-selling products. Read more
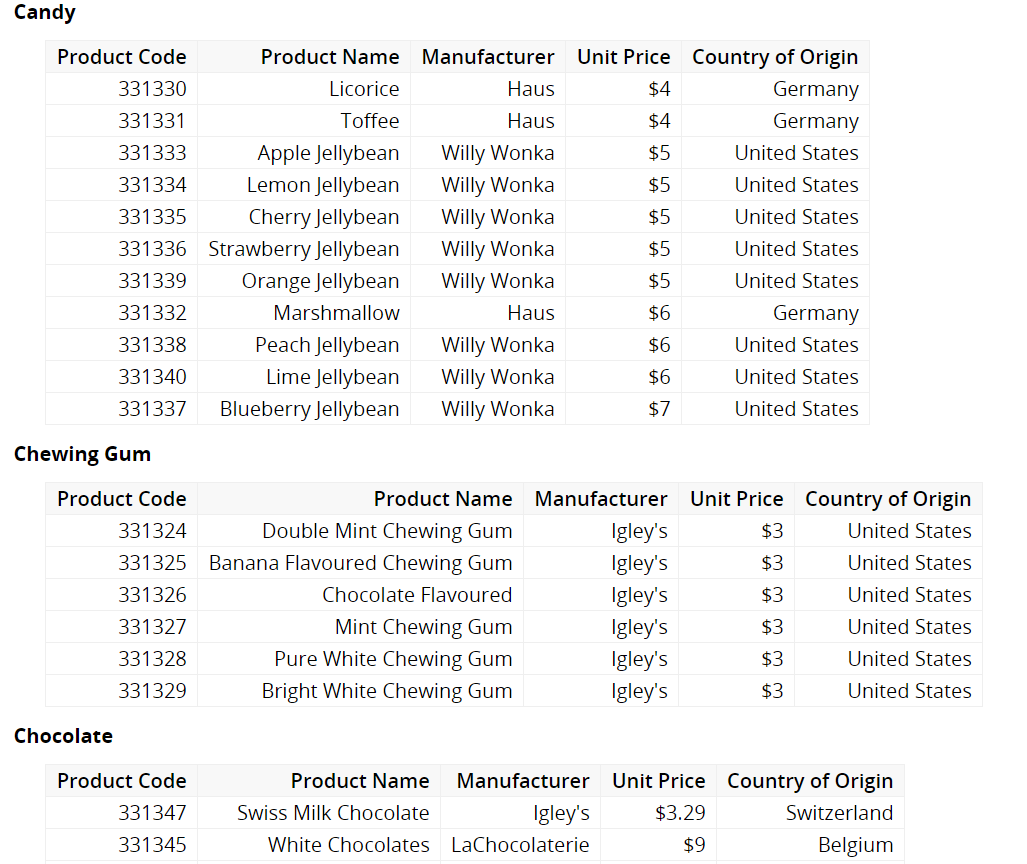
Analyzing reports in groups is made simple and sweet. Read more
Need the system to automatically fill in the end time once a task is completed? Check! Read more